Recent Performance

The figures below reflect Fairstone Group’s recent financial performance.


Figures start at the 2019 financial year and are presented up to the 2022 financial year.


(£m) FY19 FY20 FY21 FY22
Turnover 63.7 69.7 84.8 95.9
Gross Margin 18.2 22.0 32 38.3
Opex 11.9 16.6 19.4 26.4
EBITDA 6.3 5.4 12.8 12.2
Addn. secured EBITDA 10.6  13.5  24.8 24
Net assets 30.8 20.9 157.3 150.8


Key Figures


Number of acquisitions delivered/scheduled

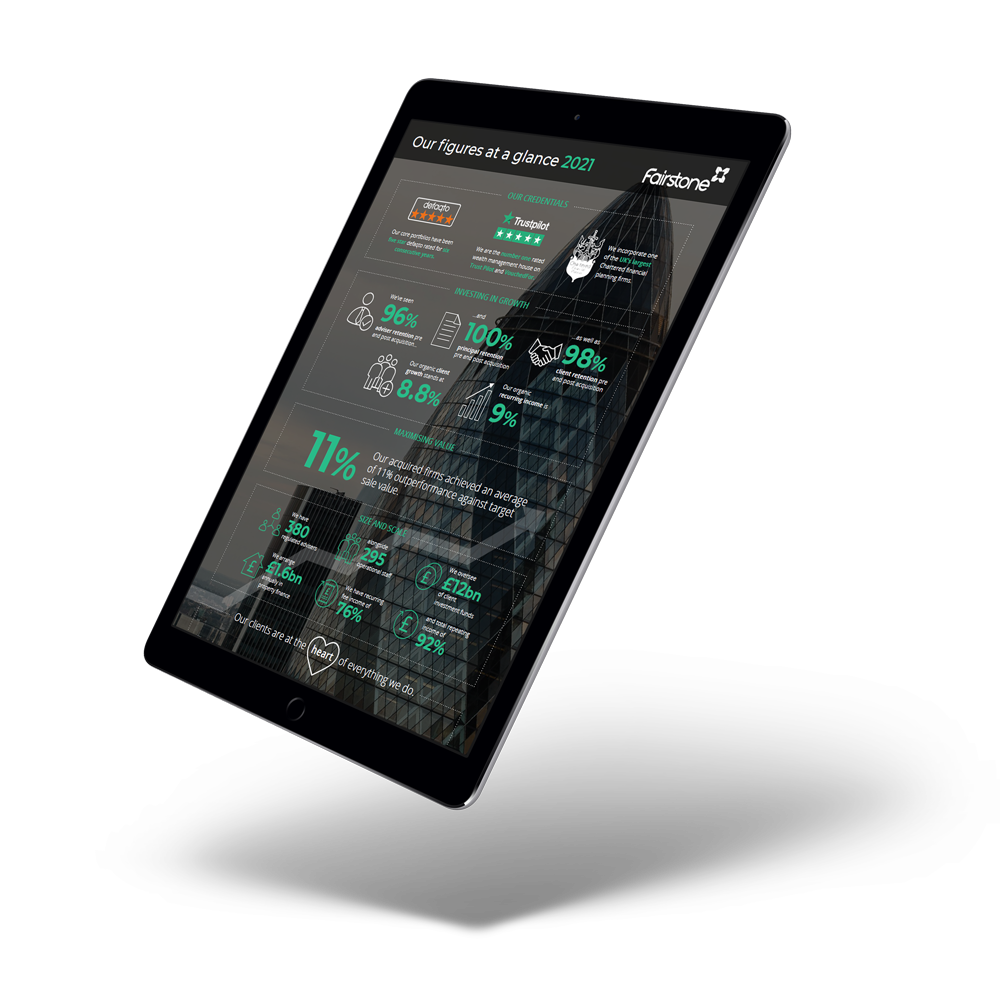
Our 2023 figures at a glance

Download

Investors

The Fairstone Group has had several investors since their founding in 2008, with total funds committed to date by each investor group/bank far in excess of £200m in aggregate.
Image showing the organisations invested in Fairstone.

Interested in partnering with Fairstone?

Our Mergers and Acquisitions team has a wealth of experience and together work to ensure the successful transition of IFA businesses and individual advisers into the wider Fairstone team.